oCelloScope™ Microbial Live Cell Imaging and Analysis
Bringing Sensitive Microbial Cell Analysis to Your Lab
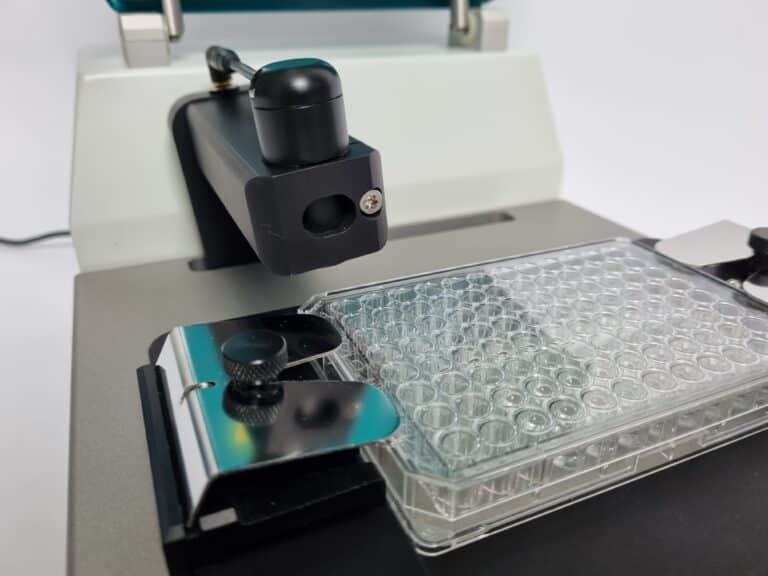
oCelloScope™ is an automated optical screening platform with an intuitive software developed specifically for microbial research.
Use any standard multi-well plate and the highly sensitive image analysis algorithm will enable rapid and real-time monitoring of microbial cell growth.
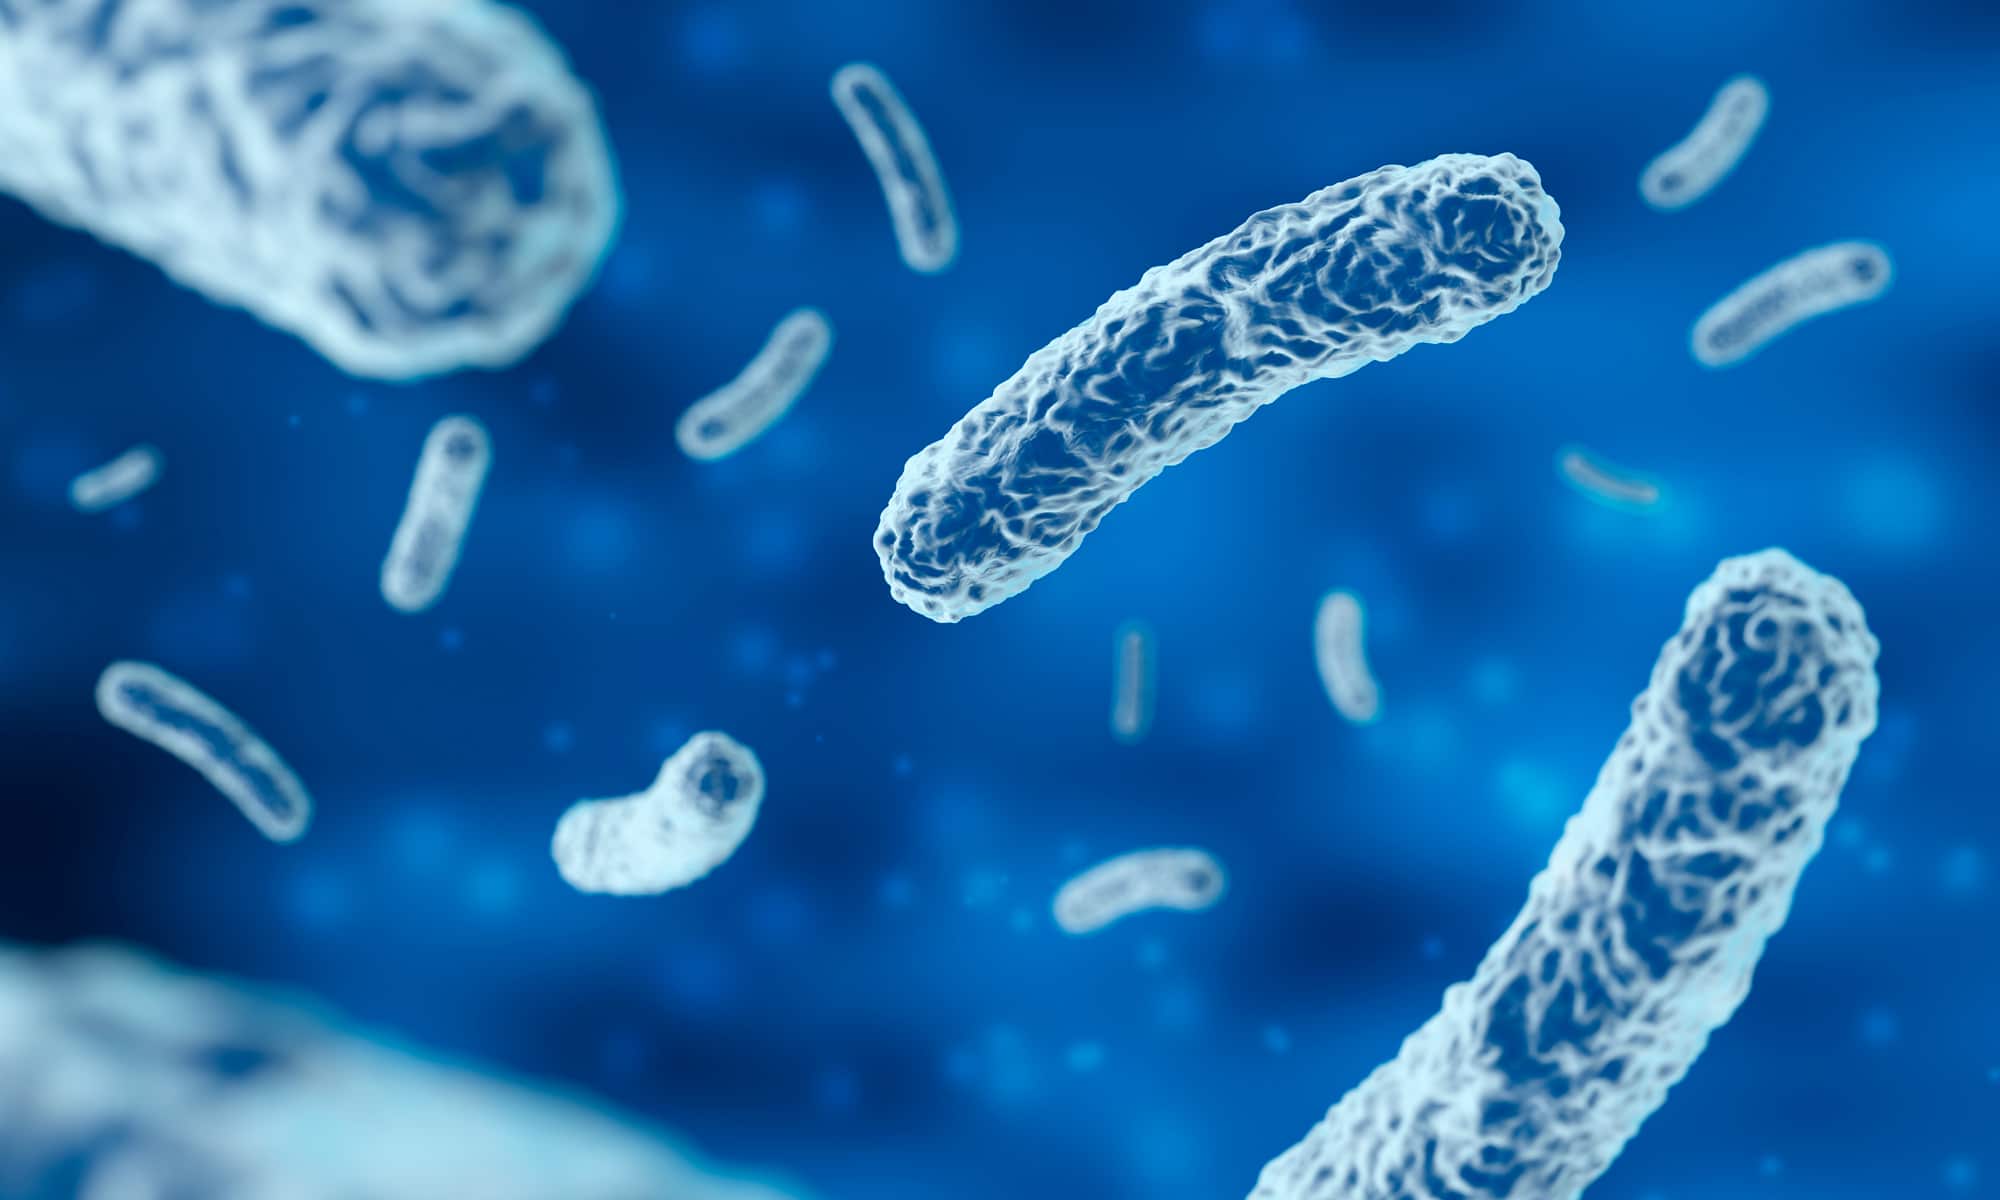
“A deep understanding of mechanisms of action of small molecules is critical for drug discovery. The research team at Venatorx Pharmaceuticals has incorporated oCelloScope, the state-of-the-art automated microscope developed by BioSense Solutions, to obtain valuable information on antibiotic effects on bacterial growth and morphology for the development of new antibiotics against clinically-important pathogens.”
Tsuyoshi Uehara
Principal Scientist of Biology, Venatorx Pharmaceuticals
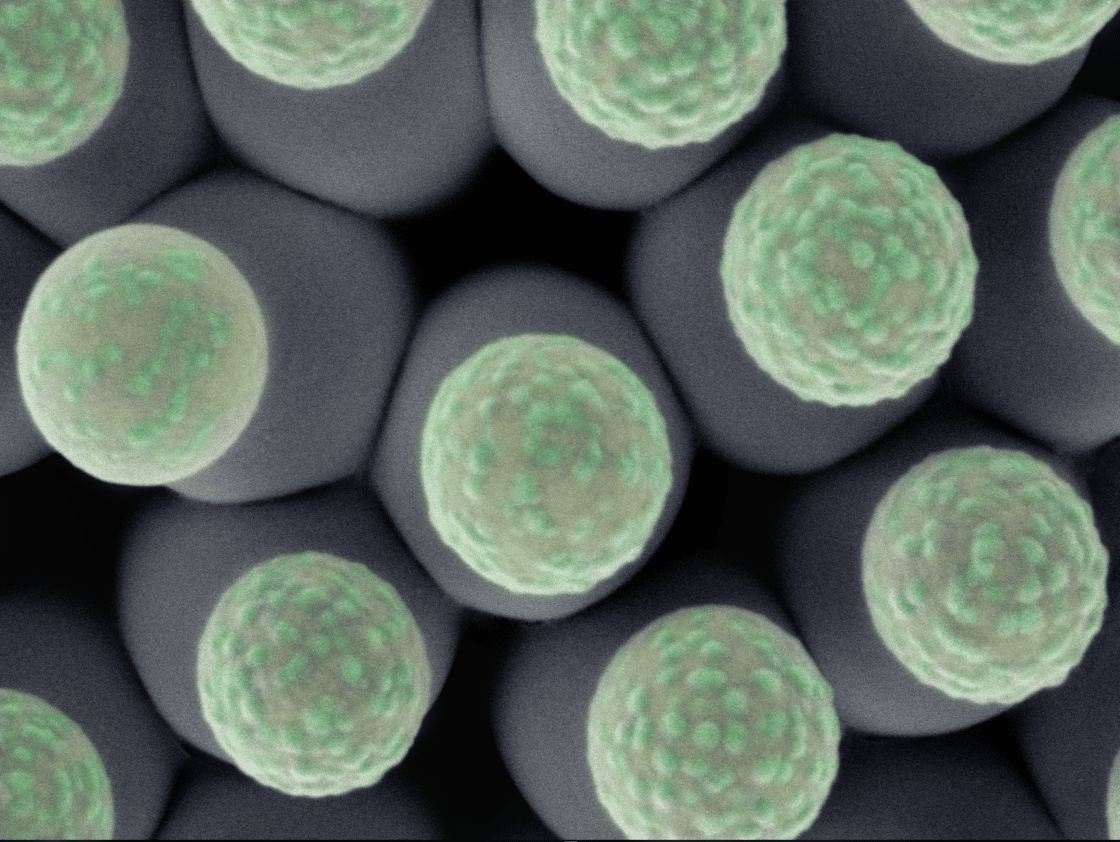
“My laboratory has been using an oCelloScope™ to rapidly assess the effectiveness of various formulations for use in cleaning and sanitizing processing surfaces in the food industry. The lower detection limit and the ability to monitor cellular morphology make this instrument superior to using a microtiter plate reader to monitor media turbidity. The software is straight forward and easy to use. It has been a great laboratory tool.”
Lynne McLandsborough
Professor, and Department Head
Department of Food Science, University of Massachusetts
“Plate and biochemical assays can show strain and hit performances, but seeing is believing. The High Throughput Assay Development Team at Ginkgo Bioworks has incorporated the oCelloscope as an essential tool for validating and troubleshooting many of our assays. The oCelloscope reliably produces high-quality microscopy data from plate screens, building the scale of Ginkgo’s platform to engineer living cells to generate better products. Customer and inter-team understanding of strain growth, treatments, and communication of assay conditions and performances is made easy with the oCelloscope.”
Dr. Sanjiv Shah
Senior Test Engineer, Ginkgo Bioworks
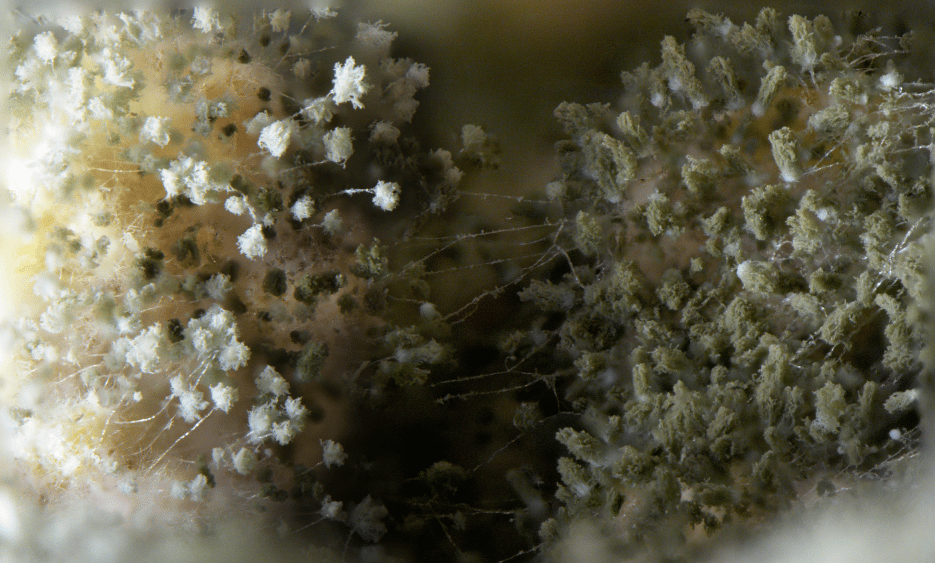
“By using the oCelloScope we were able to follow germination of thousands of individual fungal conidiospores within a population or community. We could track development of these individuals by tracing size and shape and determine the influence of different conditions on their outgrowth. That was never done before”
Dr. Wieke R. Teertstra
Researcher, Microbiology,
Kruyt building, Utrecht University
“The phage therapy group at University of Helsinki and Helsinki University Central Hospital has a long experience in conducting phagoram screenings in liquid culture using traditional adsorbance-based plate readers. The use of oCelloScope greatly increases the sensitivity of the measurement and makes it possible to conduct the whole phagoram assay within one working day.“