µCount3D
Counting of Fungal Spores, Bacteria and Yeast – Introducing the µCount3D imaging technology.
Register your interest in the new microbial benchtop counter. The µCount3D is developed to count bacteria and fungal spores. Introduction price is just €5.000 and shipments to the scientific community starts in July.
µCount3D – Automated Microbial Counting System
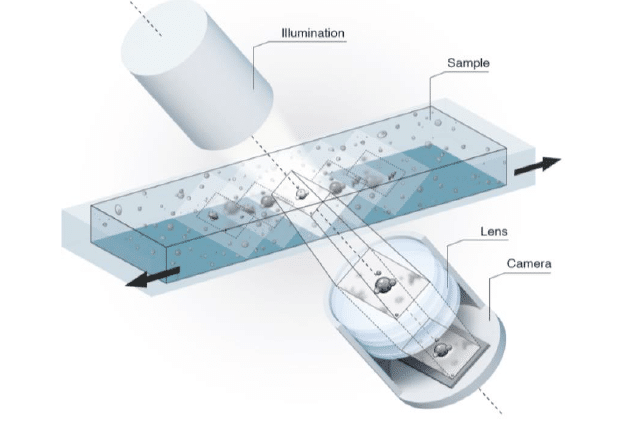
The µCount3D is developed to count pure cultures of bacteria, fungal spores, and yeasts in liquid samples. µCount3D integrates digital imaging and machine learning to provide precise and reproducible results, using our proprietary FluidScope scanning technology. The FluidScope technology employs a patented and tilted inverted camera technology.
Innovative Lab Automation
Reduce manual effort and improve accuracy by automating microbial counting processes, such as those for fungal spores and bacteria. Increase efficiency by using advanced imaging and digital technologies enable rapid sample counting, eliminating the need for labor-intensive and time-consuming manual methods
Automated fungal spore count
Traditionally, fungal spores have been counted manually under a microscope, but with the advancement of the µCount3D technology, a new, easy and automated counting technology is available.
The µCount3D from BioSense Solutions is developed specifically for microbiology and will accommodate counts of even the smallest of fungal spores.
Automated bacteria count
BioSense Solutions presents a new one-of-a-kind imaging solution to automate and count total bacteria in a pure liquid sample.
The µCount3D can assist you, if you need a fast and precise total count of your bacteria concentration prior to experimenting or need to add a certain concentration.
Scanning Technology
The patented FluidScope technology is a tilted camera technology. When images are taken, we get to film a volume instead of a plane. Every image has a height of 150µm and since images overlap we get to create both a vertical and horizontal z-stack. All objects present in this volume, is captured in focus.
For bacteria counts we use volume imaging and count bacteria present in the entire volume. Bacteria settle very slowly and are present throughout the imaged volume. Using our µCassettes with a defined inner height, we capture all bacteria down to our pixel size of 0,5µm.
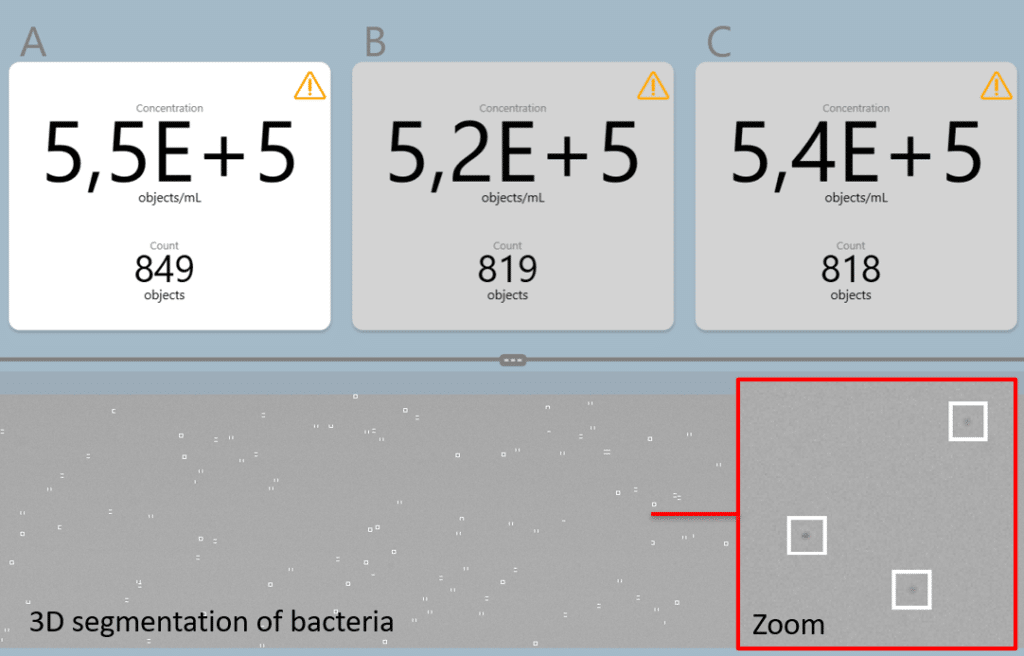
Using the µCassettes with triplicate sample chambers the Count3D software will provide total bacteria/ml or fungal spores/ml and supply images for documentation.
µCount3D Specifications
- Species: Bacteria, Fungi, Yeast and Algae
- Size: H: 20cm W: 10cm D: 20cm
- Microbe size: from 0,5µm
- Countable Range: 1 x 10⁴ – 1 x 10⁷
- 3 chamber time to result: ~8 minutes
- Output: Organisms/ml, images for documentation, PDF Report
- Sample containers: BioSense Solutions triplicate µCassetteF & µCassetteB
- Create your own specialized algorithms
Fungal Spores and Bacteria
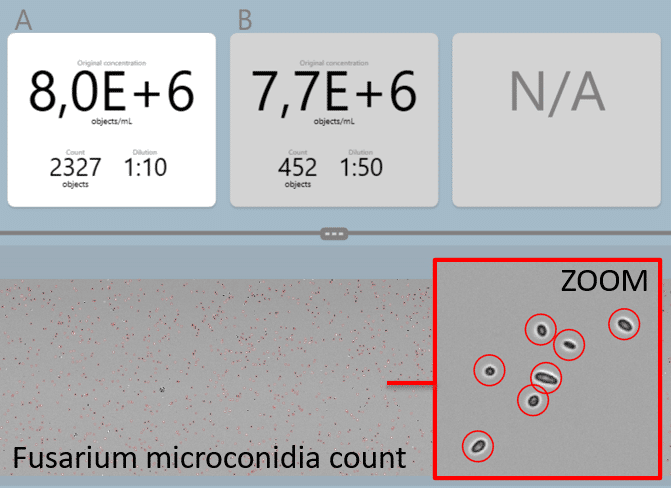
To count fungal spores we use deep learning algorithms to recognize and count spores in a sample. Counting algorithms are already widely used in our oCelloScope™ live-cell imaging technology and used in medical, crop science, and food R&D. We support a range of spores and morphologies and even provide an annotation tool for scientists to create their own algorithms.
To count bacteria we use volume imaging and count total bacteria present in a volume. Once pipetted into a sample chamber, bacteria are present throughout the imaged volume. Using our µCassettes with a defined inner height, we capture all bacteria down to our pixel size of 0,5µm. We have had the request for years and now.
Linearity response for 1 µm QC beads
Linearity response is a critical parameter in evaluating the performance of counting systems. It refers to the ability of a counting system to produce results that are directly proportional to the actual number over a specified range of concentrations.
A 2-fold dilution series with 1µm QC beads, (Bangs Laboratories Inc, Small Bead Calibration Kits, 833) have been made. Starting concentration ~2 x 10⁶ have been diluted in sterile filtered (pore size 0.20µm) demineralized water. The samples have been vortexed and 3 x 80 µL pipetted into a µCount cassette. Triplicates of all 8 samples in the range concentration from 2 x 10⁶ to 1.6 x 10⁴, have been measured in µCount3D and analyzed with the µCount software.
The plot (Figure 1) shows a linearity response of R2 = 0.9992.
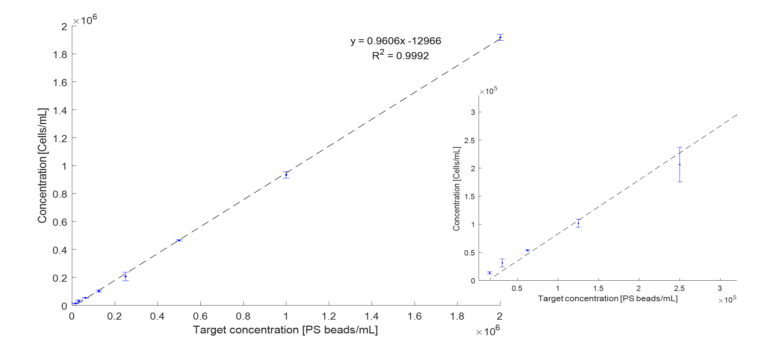
Figure 1: 2-fold dilution series of 1µm QC beads measured in triplicates with µCount3D. Measured concentration reported as a function of the target concentration. Error bars represent standard deviation. Left plot shows the full range 1.6 x 10⁴ – 2 x 10⁶, and right plot shows a zoomed range from 1.6 x 10⁴ – 3 x 10⁵.
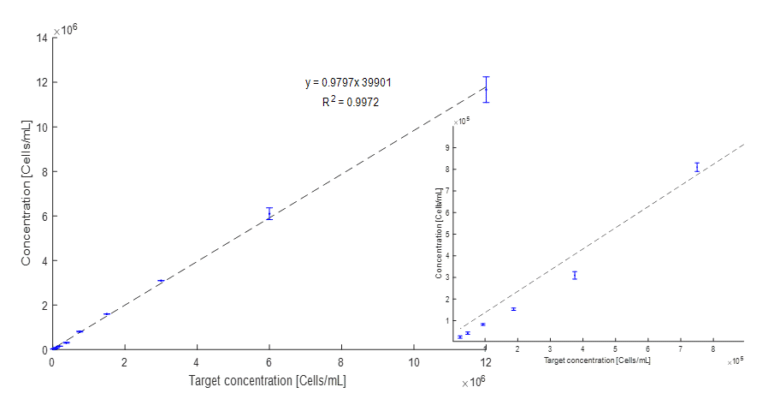
Figure 2: 2-fold dilution series of commercial product containing Bacillus spores. Samples measured in triplicate using the µCount3D instrument. Measured concentration reported as a function of the target concentration. Error bars represent standard deviation. Left plot shows the full range 2.3 x 10⁴ – 1.2 x 10⁷, and right plot shows a zoomed range from 2.3 x 10⁴ – 7.5 x 10⁵.
Linearity response for Bacillus spores
A 2-fold dilution series using a commercial nematicide product containing 3 different Bacillus spores (Bacillus subtilis, 2 x Bacillus paralicheniformis strains) has been made. Commercial product concentration ~ 1.67 x 10¹⁰. Product was diluted in sterile filtered 0.9% NaCl buffer (pore size 0.2µm) to a starting concentration of 1.2 x 10⁷. Starting concentration was adjusted using the µCount3D instrument. 2-fold dilutions were vortexed and pipetted in triplicate (3 x 80µl) into triplicate chambered µCassetteB (BioSense Solution). Triplicate of 10 dilutions with concentrations from 1.2 x 10⁷ to 2.3 x 10⁴ was measured in the µCount3D and analyzed with the Count3D software. Algorithm used: Bacteria.
The plot (Figure 2) shows a linearity response of R2 = 0.9972
µCount3D Vs. Colony counts on agar
A validation test was set up to compare counts of E. coli using the µCount3D instrument and colony counts on agar. For precision colony counting, the IntuGrow fast CFU/ml assay was used (IntuBio, Farum, Denmark, www.intubio.dk). Protocol: E. coli (K12) was grown overnight in TSB. 10ml of 0.9% NaCl buffer was sterile filtered using a 0.2µm filter to remove particles in buffer. Overnight E. coli was diluted 100X in an Eppendorf tube to reach a desired starting concentration ~ 1 x 10⁷. E. coli concentration was measured in triplicate using a µCassetteB, 65µl/chamber (BioSense Solutions, Farum, Denmark). µCount3D algorithm used: Bacteria. Experimental starting concentration was measured to be 6,97 x 10⁶ and the sample centrifuge tube was labelled “1”. For IntuGrow plate count, tube “1” was further diluted to reach an expected colony count of 20-100 colonies. For plate counts,10µl of diluted sample “1” was applied in triplicate on mini agar disks (BioSense Solutions, Farum, Denmark) with TSA. Mini agar disks were placed in a 12-well microtiter plate and agar surface was imaged using an oCelloScope™. Emerging colonies were counted using the IntuGrow software (IntuBio, Farum, Denmark). From original tube “1”, A 2-fold dilution series containing 500µl 0.9% NaCl and 500µl sample was prepared. Rack with tubes was placed under cold conditions to reduce new divisions of E. coli. A total of 8 x 2-fold dilutions was made. Procedure from tube “1” was repeated to count and plate all samples in triplicate.
The plot (Figure 4) shows a linearity response of R2 = 0.991
Comments on results. The comparison test between the µCount3D and plate counts show a very good correlation. Experiment was carried out 4 times with equal correlation. In all experiments plate counts were slightly higher than what was counted on the µCount3D. We speculate that difference might be caused by pipetting. The samples used in the µCount3D instrument was used directly from the dilution sample tube. The samples used for plate counts was further diluted 100 – 1000 times and from this 10µl was inoculated on agar. A fair assumption would be that pipette inaccuracy could be cause of difference.
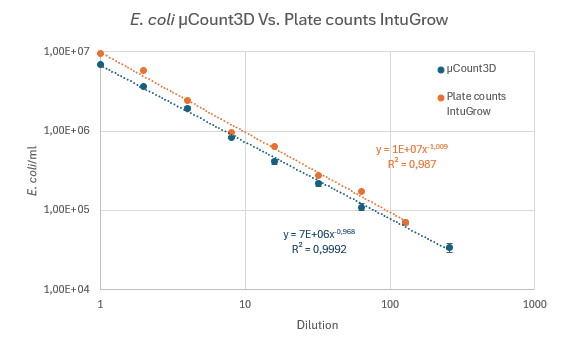
Figure 3: 2-fold dilutions of overnight E. coli culture culture in TSB. Blue line represents automated counts using µCount3D. Orange line represents colony counts on TSA using the automated IntuGrow assay.
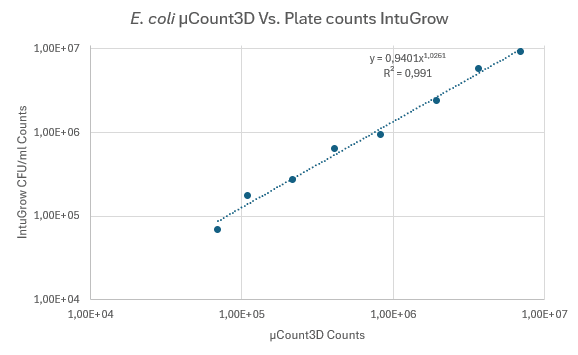
Figure 4: Correlation of counting results from µCount3D and colony counts on TSA. Same data used as in figure 3.
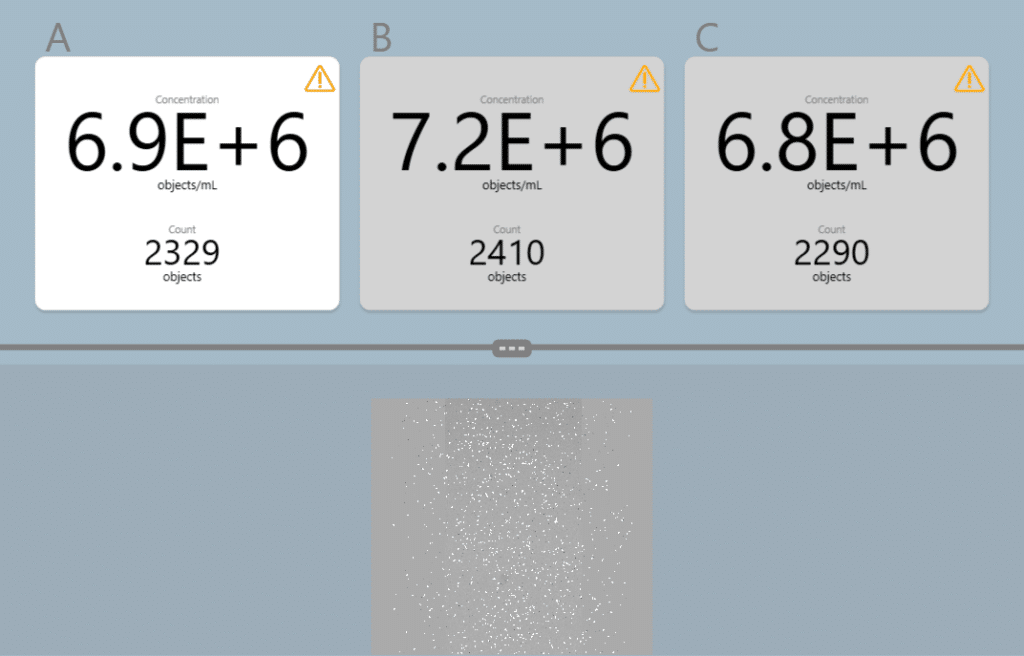
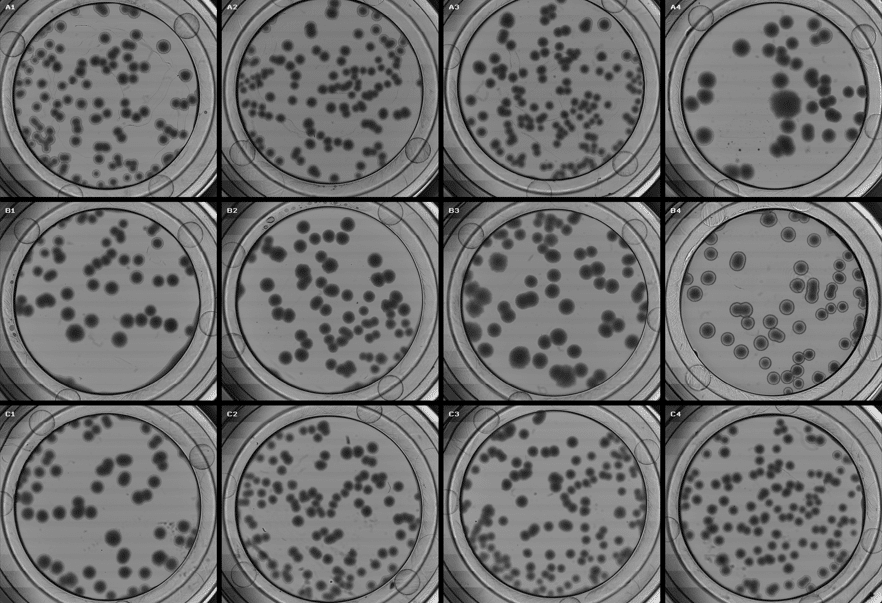
Figure 5: Software view from the µCount3D showing the first triplicate count of E-coli used in experiment (tube 1).
Figure 6: Overview image of mini-agar disks with E-coli colonies from the IntuGrow software.