Join the battle against Antimicrobial resistance with oCelloScope
New resistance mechanisms are emerging and spreading globally, threatening our ability to treat common infectious diseases, resulting in prolonged illness, disability, and death.
Scientists are demanding fast and sensitive methods to discover new antibiotics against pathogenic bacteria and fungi and push forward our understanding of these resistance mechanisms.
oCelloScope enables scientists to reduce the time-to-result, run faster screening and reduce the manual work-load, by combining growth curves with images and video, through highly sensitive and automated data acquisition and analysis.
oCelloScope: Rapid, sensitive real-time Antimicrobial Susceptibility Testing
CDC have shown that with oCelloScope you can get 4 times faster time-to-result on Antimicrobial Susceptibility Test for B.anthracis
According to Centers for Disease Control, McLaughlin et al. (2017), oCelloScope can detect the growth of B.anthracis much faster than standard methods, enabling the user to consistently get the data needed for MIC determination within 4 hours, compared to 16-20 hours for Broth microdilution (BMD).
This much greater sensitivity of oCelloScope, compared to standard methods, is obtained with the specialized embedded image analysis algorithms, that enables oCelloScope to detect single cells and quantify growth at concentrations down to ~103 CFU/ml.
E. coli growth measured with oCelloScope algorithms, BCA (red) and TA (blue) and Thermo-Fisher Scientific VarioSkan (black). Corresponding images from oCelloScope at time point 0, 120 and 240 minutes.
Accuracy in MIC Determination
Rapid time-to-result is not the only advantage of the oCelloScope.
Fredborg et al., tested 168 antibiotic-bacteria combinations, and with an overall agreement of 96% of the calculated MIC, they concluded that the rapid detection time does not interfere with the validity of the results. See the protocol for AST and determination of MIC in our application note below.
Follow the β-lactam-induced cell morphology changes on Gram-negatives
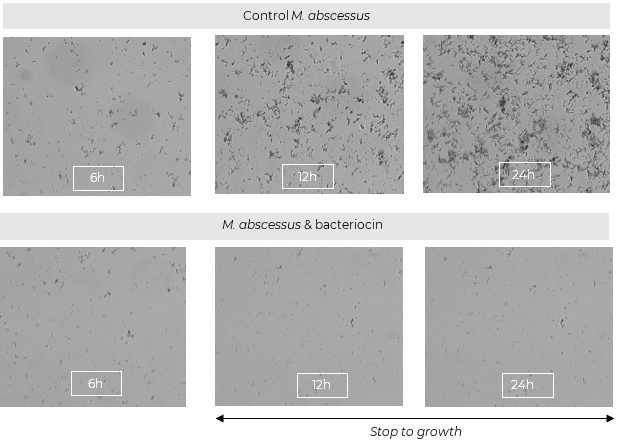
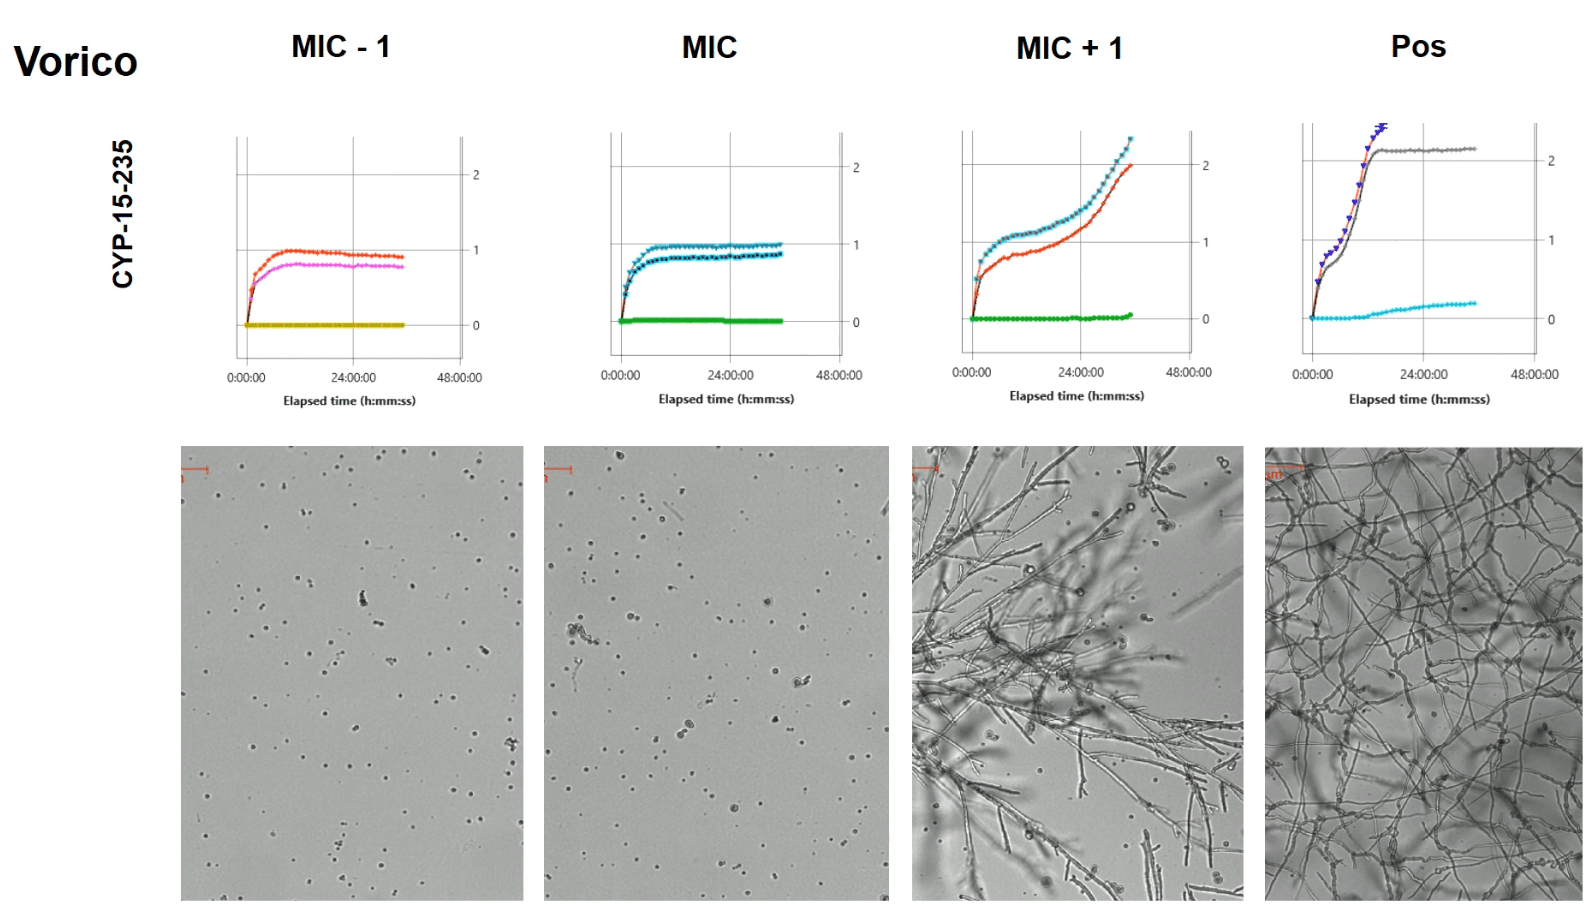
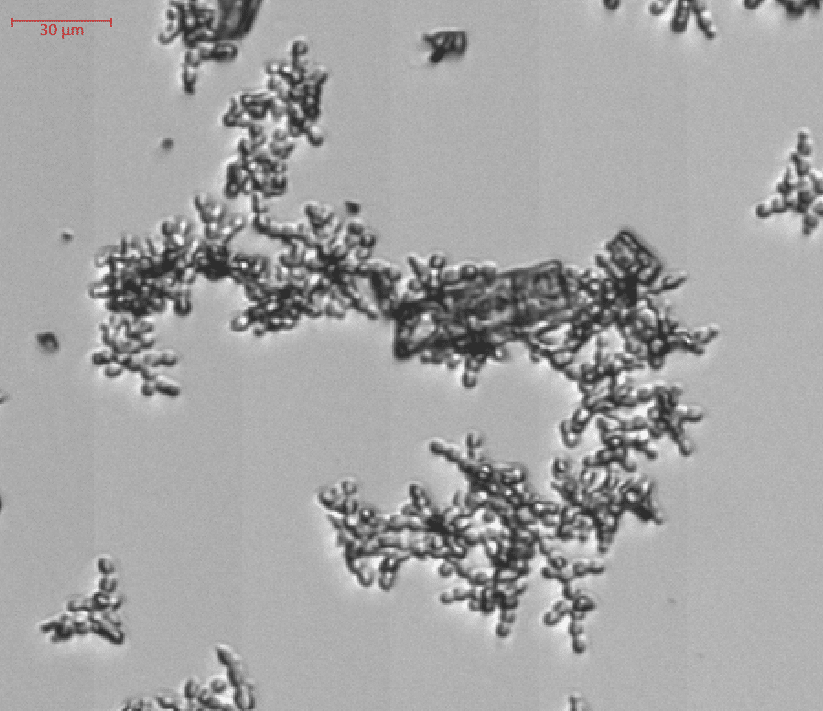
oCelloScope combines high sensitivity with real-time imaging, which enables scientist to analyse and follow cell morphology changes.
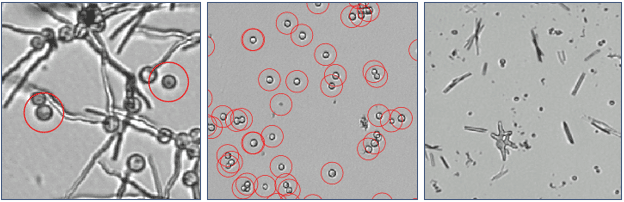
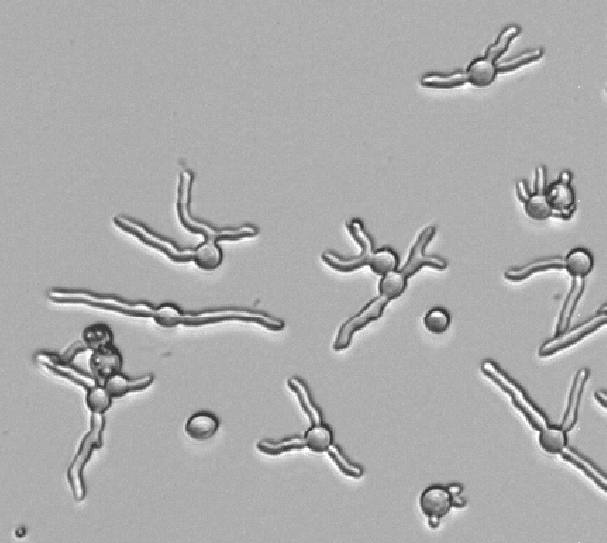
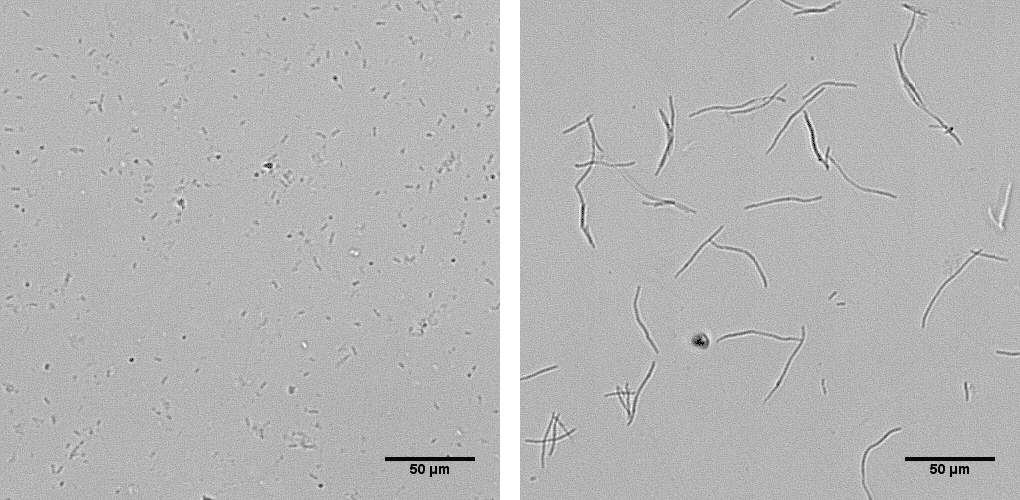
The special designed SEAL algorithm can detect filamentation of rod-shaped bacteria based on segmentation and extraction of the average bacterial length.
Learn more details and watch the videos in this recent publication from CDC, McLaughlin and Sue (2018), where SEAL was used to measure the average cell length (μm) of B. pseudomallei strains Bp82 and JB039 in the presence and absence of CAZ.
Mycobacterium
oCelloScope is used to evaluate antibacterial activity of bacteriocins as a new therapeutic option for the treatment of Mycobacterium abscessus infection in patients with cystic fibrosis. Mycobacterium abscessus is one of the most drug resistant bacteria among the rapidly growing mycobacteria (RGM) and is naturally resistant to the current antibiotics used, including almost all anti-tuberculosis agents. Click below to find an application note from Syngulon and Saint Luc Hospital in Belgium.
Quantify Colony Growth
With the introduction of mini agar disks we challenge classical visual inspection on agar. The colony module in our software will enable you to time-lapse and quantify growth of bacteria from just 10µm in colony size. With the module we enable users in Antimicrobial Susceptibility Testing to compare findings in broth to that on agar.
In video, you can see how you can select some or all bacteria on disk and analyze growth. Selection can be manual or according to different selection criteria such as circularity, aspect ratio or area. You may choose any or all time points.
Fungal AST
There are millions of fungal species, but only a few hundred of them are known to make people sick. During Covid-19, The most commonly reported fungal infections in patients include aspergillosis, invasive candidiasis, and mucormycosis (also called ”black fungus“). The oCelloScope is widely used in fungal AST research has been shown to accurately supply a 12-hour phenotypic drug susceptibility testing for Aspergillus fumigatus. BioSense Solutions have developed specific algorithms to track fungal growth and in combination with machine learning algorithms that track spore germination, the time frame is highly reduced compared to macroscopically read MIC’s at 48 hours.
Clinical Sample of Aspergillus Fumigatus with different concentrations of antibiotic.
A. fumigatus machine learning algorithm is used to track spores. Results shown as % germination. First increase in curve is settling of spores on the bottom of well. Algorithm tracks spores from dormant through swelling stages. Once isotropic growth occurs algorithm lets go and curve drops.
Machine Learning in Fungal AST
To help combat fungal diseases, BioSense Solutions have developed algorithms trained to recognize and count spores from specific fungal species. The aim of this project development was to help scientist achieve faster and more precise results. Goal is to shorten analysis time and imagine if we can bring down fungal drug-susceptibility testing to hours instead of days. In addition, Itraconazole can make crystal precipitates in solution and give erroneous readings in plate readers. Such unwanted event are visualized with the oCelloScope technology. Spore counts can be run in triplicates with error bars on a 96-well plate.
Germ Tube Analysis
In our quest to reduce fungal AST time we have developed an algorithm to track germ tubes on spores. This we can combine with both spore count and growth kinetics. If we combine the germ tube algorithm with above spore count algorithms we would see an increase in germ tube development right when the above curve starts to drop. If we include kinetics as well we can also get confirmation that the sample will actually enter a vegetative state.
Aspergillus Fumigatus